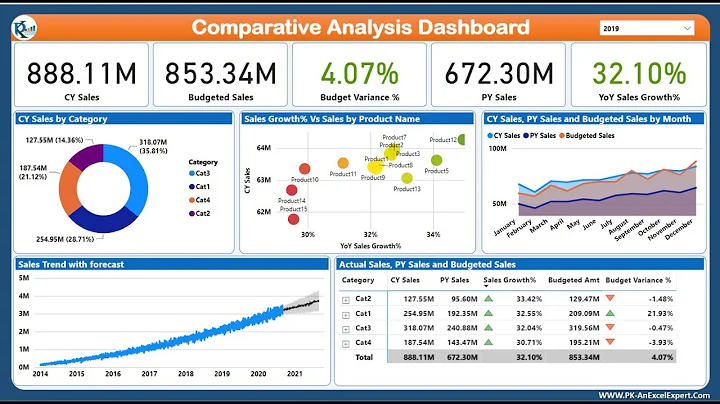
A complete bi retail data analysis report will have multiple data visualization charts with specific analysis angles. So, when making reports, what operations do we need to preset the data analysis angle, while ensuring that each report viewer can adjust the analysis angle according to his or her own analytical thinking at any time?
To meet the above requirements, you need to set the summary, row dimensions, and column dimensions of the chart under the data set builder of the bi data visualization tool .
summary : are some indicators or fields that will be displayed and can be used to measure or calculate.
row dimension : This is the angle from which data analysis will be performed. There can be multiple angles. For example, you can add two row dimension indicators of "store and category" at the same time.

column dimension : This is a function that will be used when making cross-type retail data analysis charts. For example, if you want to make a cross report that views each category by store, you can add a "category" to the column dimension.
The effect before inserting "category":

The effect after inserting "category":

How to make the above settings in the data set builder?
Aowei bi data visualization tool uses code-free operation. Just click the "+" on the right side of summary, row dimension and column dimension under the data set builder to add the indicators we need and set Analysis perspective.
In the same way, if you want viewers to be able to set the analysis angle according to their own needs at any time, they need to first click on the small icon in the upper right corner of the specific retail data visualization chart, call up the data set builder, and click on the original Delete the original indicator by clicking "..." on the right side of the specified indicator, and then click "+" to re-add the indicator required by the viewer, thus modifying the data analysis angle.
In station B, an up owner made a series of videos on bi retail data visual analysis and report production. If you are interested, you can click retail data analysis , retail data analysis report production to watch related videos faster. Experience the effect of visual analysis of bi data, master the skills of making bi reports, and complete your own visual analysis of bi retail data.
If you want to understand retail data analysis more systematically, you can enter the retail bi solution special page to have a deeper understanding of this systematic retail system that combines Aowei Software's 16 years of bi experience and the common analysis needs of the retail industry. Data analysis solutions.


