Heart of the Machine Column
Author: Ant Group - Big Security - Digital Identity and Security Ecology, Zhejiang University
Researchers from Zhejiang University and Ant Group - Big Security - Digital Identity and Security Ecology proposed a tag-based relationship Tree-level residual multi-granularity classification network HRN.
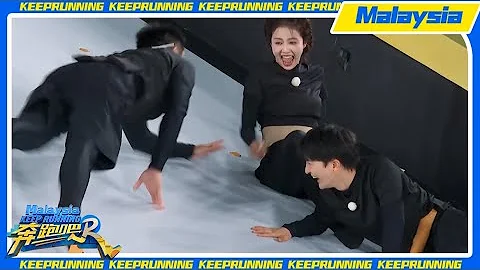
One aspect of the image recognition task based on supervised deep learning is to construct and organize large-scale, high-quality annotation data, which has relatively high requirements on image quality and the background knowledge of the annotators. For example, in fine-grained classification tasks, annotators need to rely on a large amount of domain knowledge to distinguish various types of birds and different models of ships, as shown in Figure 1.

Figure 1: Different species of Albatross and different models of aircraft carriers
In Figure 1, the annotator needs the knowledge of a bird expert to identify Black-footed Albatross and Laysan Albatross . Those with general bird knowledge Personnel may classify these two birds as albatrosses, whereas persons with less bird knowledge may classify these two species only as birds. Similarly, annotators would need the knowledge of military ship experts to effectively distinguish between Nimitz-class aircraft carriers and Enterprise-class aircraft carriers, while those lacking relevant background knowledge might classify these two types of ships as aircraft carriers. In other words, the same image will be annotated into categories of different levels of granularity by annotators with different background knowledge.
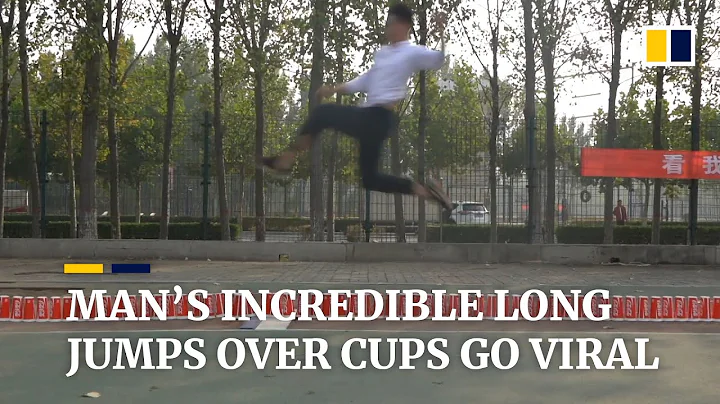
In addition to the impact of background knowledge on annotation, image quality factors such as the key areas in bird identification being occluded, low image resolution, or blurry images will also interfere with the labeling of image targets in hierarchical multi-granularity labels. Which type of judgment is shown in Figure 2.
Figure 2: Due to changes in image quality such as occlusion and resolution and differences in expert background knowledge, targets may be annotated at different levels
However, in the traditional image recognition data set category setting, for a specific task, for example In general image classification tasks or fine-grained classification tasks, category labels are often only located at the same level. Images annotated to different levels cannot be used in and robustly, and the requirements for annotation are relatively high. In order to reduce the high requirements for annotation data caused by image quality and background knowledge, and make full use of samples with different levels of granularity labels, designing a hierarchical multi-granularity recognition algorithm that models the target hierarchical semantic structure is helpful to improve the robustness of deep neural networks. plays a very important role. To this end, Zhejiang University and Ant Group proposed a hierarchical residual multi-granularity classification network based on label relationship trees, which was included in CVPR022.
- Paper address: https://openaccess.thecvf.com/content/CVPR2022/papers/Chen_Label_Relation_Graphs_Enhanced_Hierarchical_Residual_Network_for_Hierarchical_Multi-Granularity_CVPR_2022_paper.pdf
- Code address: https://github.com /MonsterZhZh/HRN
Algorithm introduction
We build our starting from three observations Hierarchical multi-granularity classification algorithm: (1) Since fine-grained categories can be iteratively classified upward according to different levels of abstraction to form a tree category structure, we build a corresponding label relationship tree to model the semantic relationship between hierarchical categories; (2) ) Design a composite loss function based on the label relationship tree, so that samples with different levels of granularity annotations can transfer knowledge between levels during learning; (3) In the real world, subclasses located at low levels will further inherit their own unique attributes. For attributes from the parent class, we first set up a dedicated feature extraction layer for each level, and extract features related to each level based on the features output by the backbone network. Then we refer to the classic residual connection design in the deep residual network to realize that all parent class-level features are integrated into sub-class level-specific features in the form of residual connections, which are then used for current-level category classification. Hierarchical Residual Network (HRN).
tag relationship tree
tag relationship tree
is composed of node set
, directed edge set
, and undirected edge set
. Each node
corresponds to a category label in the hierarchy. The number of nodes in the graph n is equal to the number of all labels in the hierarchy. A directed edge
represents the parent-child relationship between nodes
, and category i is the parent category of category j. An undirected edge
represents the mutually exclusive relationship between nodes
and
. The value of each category label in the hierarchy is a binary value, namely
, which represents whether the target has this category label. Each edge in the graph limits the value of the connected nodes: it is illegal to assign a value to two nodes
connected by edges with a parent-child relationship (it is Labrador but is not a dog); for nodes connected by edges connected by a mutually exclusive relationship The assignment of two nodes
is illegal (both Corgi and Labrador). All edges in the graph constrain the legal values of adjacent category nodes in hierarchical multi-labels. A global legal assignment for all labels in the hierarchy is a binary label vector
. The set of all global legal assignment vectors constitutes the legal assignment space
owned by the label relationship tree G.
Hierarchical residual network
Figure 3: Hierarchical residual network structure diagram
Hierarchical residual network (HRN) based on residual cross-level connection consists of a backbone feature extraction network, hierarchical feature interaction module, and two parallel output channels ,As shown in Figure 3. Any commonly used network can be used as the backbone network to extract features of the input image. We choose the widely used deep residual network ResNet-50 as the backbone network of the HRN network. The hierarchical feature interaction module includes a feature extraction layer and residual connection part specific to each level. The hierarchical proprietary feature extraction layer network structure is consistent, including two convolutional layers followed by two fully connected layers (FC). The level-specific feature extraction layer extracts features specific to each level based on the shared input features generated by the backbone network. The residual connection part first linearly combines features from the coarse-grained parent class level and fine-grained subclass level features, reflecting that the subclass not only has its own unique attributes but also inherits attributes from the parent class. The proprietary feature extraction layer at the parent class level can be regarded as a residual connection that combines the features of its own level into the features of the subclass level layer by layer.
Then, we apply non-linear transformation (ReLU) to the combined features and send them to subsequent network layers. Finally, the network still sets up two parallel output channels. The first output channel is used to calculate the probabilistic classification loss function based on the label relationship tree. The sigmoid nodes in the channel correspond one-to-one to each category label in the hierarchy. All sigmoid nodes are organized according to the label relationship tree. The softmax node in the second output channel corresponds to the mutually exclusive fine-grained categories in the last level, forming a multi-class cross-entropy loss function to allow the network to focus on the error of fine-grained classification when optimizing.
compound loss function
Given an input image
The joint output probability of all sigmoid nodes corresponding to the assignment vector in the channel can be calculated as:
- , representing the sigmoid output of the i-th node in the hierarchy
- , representing the label relationship tree defined by The hierarchical constraint
- is used as probability normalization, summing all legal assignments in the label relation tree
If the input image x is annotated to the ith label in the tree, namely
, we can calculate the marginal probability of label i:
Analyzing the calculation formula of edge probability, we can find that: (1) The edge probability of a label in the graph depends on the sum of the scores of all parent nodes of the label. Because the label is assigned a value of 1, all its parent nodes should Assign a value of 1 to satisfy the hierarchical constraint relationship. Therefore, the calculation of edge probability can make the score value of the parent node affect the predicted value of the child node. (2) When calculating the edge probability of the middle label in the hierarchy, it is necessary to include the joint probabilities corresponding to all its subclass labels, that is, the knowledge from the subclasses can be aggregated. Finally, given m training samples
, we obtain the probability classification loss function with maximum likelihood marginal probability:
- represents the assigned label vector, which is the label subscript marked into the label relationship tree.
In order to further enhance the network's ability to distinguish fine-grained leaf nodes, we further combine multi-class cross-entropy loss functions to form a final composite loss function to optimize the entire network:
is selectively combined according to whether the sample is labeled with leaf nodes. Cross entropy loss function and probabilistic classification loss function.
experiment
data set
We commonly use three sets of fine-grained classification data sets: CUB-200-2011, FGVC-Aircraft, and Stanford Cars. Set a hierarchical label relationship tree for each data set according to Wikipedia . CUB-200-2011 contains three levels of 38 orders, 38 families, and 200 species; FGVC-Aircraft has three levels of 30 makers, 70 families, and 100 models. levels; and Stanford Cars has 9 car types, 196 car makers in two levels.
Experimental indicators
We use two sets of experimental indicators for evaluation: measuring the accuracy (OA) of each level and the common indicators in hierarchical classification
, that is, first calculating the average precision-recall (PRC) curve on each category, and passing a certain threshold, obtain a point in the average PRC curve
:
obtains the average PRC curve by setting different thresholds,
is the area under the average PRC curve.
Experimental design
We simulate two limitations that exist in the real world: (1) Simulate the difference in subjective expert knowledge: select samples located in the fine-grained leaf category, and select 0%, 30%, 50%, 70% and 90% of the samples are relabeled to their corresponding parent class labels; (2) Simulate the impact of image quality: the selected relabeled samples will further reduce the resolution of their images.
ablation experiment
In Table 1, we verify the hierarchical residual network contains the hierarchical proprietary feature extraction layer (GSB), hierarchical feature linear combination (LC), and nonlinear transformation (ReLU) for the combined hierarchical features. The role of each part:
Table 1: By gradually adding the key parts of the HRN network: the granularity-specific feature extraction layer (granularity-specific block, GSB), the linear combination of features between levels (linear combination, LC), and finally for The non-linear transformation (ReLU) of combined features was used to obtain the experimental results of OA(%) corresponding to the re-labeling ratio of 0% on the last level in the CUB-200-2011 data set.
In Table 2 we verify the role of the multi-class cross-entropy loss function in the composite loss function:
Table 2: Verification of the combined effect of the probabilistic classification loss function
and the multi-class cross-entropy loss function
under different relabeling ratios, report CUB -200-2011 Experimental results of OA (%) on the last level in the data set
In Table 3 we compare the results of the composite loss function with the traditional hierarchical classification loss function:
Table 3: CUB-200-2011 data set The relabeling ratio at the last level is 0%. Comparing the OA(%) of the composite loss function and the traditional hierarchical classification loss function. Experimental results
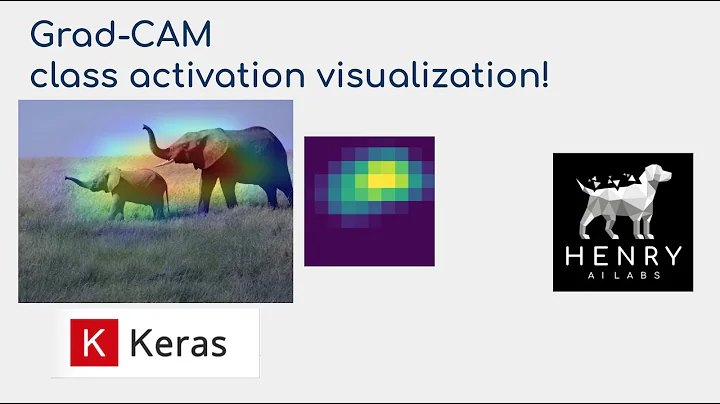
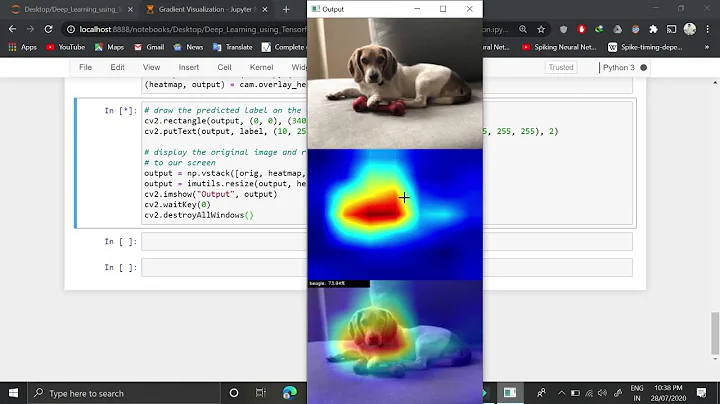
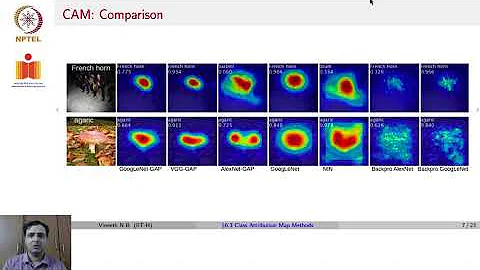
In Figure 4, we use the Grad-Cam visualization algorithm to display the two-dimensional activation heat map of the response at each level:
Figure 4: Two-dimensional activations generated by our method on pictures of birds from the same order (order: Passeriformes) and the same family (family: Troglodytidae) and the following two species (species: House Wren and Marsh Wren) on the bird data set Heat map
Comparison experiment
We compared 4 recognized hierarchical multi-granularity classification methods: HMC-LMLP[1], HMCN[2], Chang et al.[3], C-HMCNN[4]. We summarize the average OA/results of the contrasting methods in each dataset and different relabeling ratios in Table 4:
Table 4: The average OA/results of the contrasting methods in each dataset and different relabeling ratios
Similarly, We use the Grad-Cam algorithm to display the two-dimensional activation heat maps of each comparison method at different levels. The results are shown in Figure 5:
Figure 5: CUB-200-2011 data set comes from the same order (order: Passeriformes) and the same family (family: Troglodytidae) On the bird pictures of the following two species (left: House Wren, right: Marsh Wren), different comparison methods have respective response areas of interest at three levels. Example
Reference
[1] Ricardo Cerri, et al . Reduction strategies for hierarchical multi-label classification in protein function prediction. BMC Bioinformat., 17(1):373, 2016.
[2]Jonatas Wehrmann, Ricardo Cerri, and Rodrigo Barros. Hierarchical multi-label classification networks. ICML, 2018.
[3]Dongliang Chang, et al. Your” flamingo” is my” bird”: Fine-grained, or not. CVPR, 2021.
Eleonora Giunchiglia and Thomas Lukasiewicz. Coherent hierarchical multi-label classification networks. NeurIPS, 2020 .


![[FULL(ENG.Ver)] EP1-3: The First Pre-Contest Evaluation | 乘风2024 Ride The Wind 2024 | MangoTV - DayDayNews](https://i.ytimg.com/vi/xuf0yGYQaaE/hq720.jpg?sqp=-oaymwEcCNAFEJQDSFXyq4qpAw4IARUAAIhCGAFwAcABBg==&rs=AOn4CLBZKWdeuSUBLrlRARHTo2fcQgk51Q)