International oil market
Brent rebounds as China's demand hits record high
Brent crude rebounds from 12-year low, after previous data showed China's oil demand hit a record high, but the world's energy regulator warned that the market may be "oversupplied" "submerged, limiting gains in Brent crude and pushing U.S. crude to its lowest level since 2003. Brent crude oil ended up 0.7%, or $0.21, at $28.76 a barrel. U.S. crude oil settled at $28.46 a barrel, down $0.96, or 3.26%, to its lowest level since September 2003.
Global Gold Market
Gold prices held steady as the dollar and oil prices turned lower, off daily lows
Gold prices remained steady on Tuesday as the dollar turned lower, U.S. crude oil fell below $29 a barrel again, and U.S. stocks pared gains. China announced that its economic growth rate in 2015 officially dropped to "6 times", the lowest in 25 years, igniting people's hopes for stimulus measures from the government and causing investors to flock to risky assets. Gold prices were weak for most of the session. Spot gold rose 0.05% to $1,089.15. U.S. February gold futures settled down 0.1% at $1,089.10. Analysts said weak physical demand from China and India also limited gold's gains. Chinese consumer spending has been weighed down by the economic slowdown. Platinum climbed 1.1% to $827.75 an ounce; silver rose 1% to $14.06; and palladium rose 0.4% to $493.18.
Global Forex Markets
1, Pound hits seven-year low as central bank chief warns impact of China's slowdown may increase
The pound fell to a seven-year low against the dollar on Tuesday after Bank of England chief Carney warned that China's slowdown could have a negative impact on the UK economy The greater danger is that it has not set a timetable for raising interest rates. Carney's comments weighed on sterling, which fell to its lowest level since early 2009 at $1.4130. Sterling has fallen 9% against the dollar and euro since early December. The slowdown in China's economy will further weaken the UK's economic growth and inflation prospects. Brexit worries continue to weigh on the pound.
2. Falling oil prices and a global economic slowdown dragged down the dollar's gains.
The dollar trimmed its gains as concerns about falling oil prices and a global economic slowdown intensified, prompting investors to turn to safe-haven currencies. The dollar fell against the Swiss franc and gave up most of its early gains against the yen. The U.S. dollar index was flat. The dollar rose 0.2% against the yen to 117.55 yen. The euro rose 0.2% against the dollar to trade at $1.0913. The dollar fell 0.2% against the Swiss franc to 1.0031 Swiss francs. The dollar performed well against the pound, which fell to a seven-year low after Bank of England chief Mark Carney said there was no "timetable" for raising interest rates. In late trading in New York, the pound fell 0.45% against the dollar to trade at $1.4177.
Outlook
What investors in crude oil need to focus on today is that in the evening, the United States will release three data: the monthly seasonally adjusted CPI rate in December, the total number of construction permits in December, and the annualized total number of new housing starts in December. It is expected to have short-term effects on crude oil. Guidance; in addition, please note that the expected changes in API crude oil inventories for the week will be announced in the early morning of the next day.
In terms of trading conditions
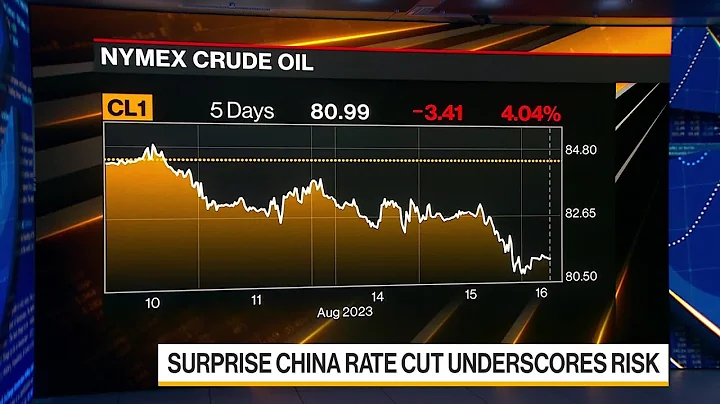
Judging from the intraday trend of crude oil prices on Tuesday, the Asian and US markets have a larger trend. The bulls have dominated the Asian market throughout the period. After a slight shock at the opening, it continued to fluctuate upward, directly testing the high of the previous trading day. points, and during the European session, the overall performance was mediocre, but bulls still had the advantage. What was surprising was the trend in the US session in the evening. After a slight shock at the opening, oil prices fell rapidly, and fell to the previous support level in one fell swoop. On the top, the bullish rebound has come to an end at this point. After a slight rebound, it turned down again and hit a new low. The low closed directly at the previous low. It can be seen that the dominant force displayed by the shorts in the session is very strong, and the follow-up is very promising. It is possible that it will break through further downwards and hit a new historical low. It is recommended that investors mainly open short positions on the rebound; in terms of news, the news in the white market is light, mainly to further digest the short-term positive factors of the previous trading day, and the oil market has gone out of a short-covering market. In the evening, the IEA monthly report warned that the crude oil market may be oversupplied, which directly suppressed the bullish power of the short-term rebound. The IMF also released a latest research report, which lowered the global economic growth forecast for this year and next, and also lowered the forecast for the U.S. economy. Growth forecasts and the slowdown in global economic growth have further aroused market concerns about reduced demand for crude oil. U.S. crude oil has been suppressed to the lowest level since 2003, and the outlook is not optimistic.
Crude oil market analysis
Let’s first review yesterday’s market. Yesterday, the market opened higher and went up, reaching the intraday high of around 200 in the European market, and then fell due to resistance. It reached 186 in the early morning. Looking at the daily chart, yesterday's closing was a small negative with a shadow line, the 5.10-day moving average went flat, the MACD green energy column in the attached picture decreased, and the KDJ stayed stuck in the oversold zone. From the 4-hour chart, the 5-day moving average crosses below the 10-day and 20-day moving averages, the MACD red energy column weakens, and the KDJ crosses downwards. Taken together, the shorts have full momentum. Analysts believe that today we can still operate mainly at high altitudes, supplemented by defensive long orders. There are a few points to pay attention to when placing orders today. The first point is to talk about the issue of following the trend of placing orders. That is, when the market does not have a big rebound, but the market fluctuates up and down, the idea of mainlying high and low remains unchanged. This is still is emphasized today. The second point is still to emphasize the issue of position breaking. There are generally two types of position breaking. One is when the price deviates far from the pressure level. The second type is when the price reaches a breaking point and there is confirmation of the pattern later. The third point is that the EIA will not be announced today and will be postponed until tomorrow. The fourth point is to pay attention to the pressure near 195 above.
crude oil operation advice: enter the market with a short order near
1.191, with a loss of 195, the first target is 185, hold if the position is broken;
2. breaks through 195 and stands firm, if it falls back to 193, it will lose 3 points, the first target is 200, hold if the position is broken
3. Suggestions are for reference. The specific orders are given
"Three Looks" so that you can easily understand the crude oil price trend chart
Crude oil investment. Looking at the crude oil price trend chart is the most basic. The crude oil price trend chart refers to a chart formed by recording the changes in international crude oil prices within a certain period of time through software. From the chart, the changing trend of international oil prices can be clearly seen.
Investors can analyze the fluctuations in crude oil prices based on some data or information on the market, and at the same time predict future price trends. So, for novices, how to understand the crude oil price chart?
First: Look at Yin and Yang
The crude oil price chart uses yin and yang to indicate the trend direction of the crude oil market. The positive line indicates that the price will continue to rise, and the negative line indicates that the price will continue to fall.
For example, taking the market represented by the Yang line as an example, after a period of long-short struggle, the closing price of crude oil is higher than the opening price, which means that the bulls have the upper hand at this time.
In the absence of emergencies or external interference, the market will continue to run in the original direction. That is to say, when a positive line appears on the crude oil price chart, it means that crude oil prices will continue to rise in the next stage.
Second: Look at the entity size
The entity size on the crude oil price chart represents the internal driving force of the price.In crude oil investment, the larger the entity, the more obvious the upward or downward trend; the smaller the entity, the less obvious the price trend. Taking the Yang line as an example, in this state, the entity is the part where the closing price is higher than the opening price.
In other words, the larger the Yang line entity is, the more internal power the market has to rise. On the contrary, there will be insufficient upward momentum. In the same way, it can be seen that the larger the Yinxian entity is, the greater the downward momentum will be.
Third: Look at the length of the shadow line
There is also a line in the crude oil price chart that can also provide guidance for our crude oil trading. This line is called the shadow line.
In the price chart, the shadow line represents a turning signal. The longer the shadow line extends in one direction, the less conducive it is to the movement of crude oil prices in this direction. In other words, the longer the upper shadow line, the less conducive it is to the rise of crude oil prices, and the longer the lower shadow line, the less conducive it is to the fall of crude oil prices.
In crude oil investment transactions, investors can basically understand the crude oil price trend chart by understanding the meanings of the above aspects. It is not enough to just understand the crude oil price chart. Investors also need to continuously accumulate experience, be proficient in fundamental and technical analysis, and summarize methods and techniques that suit them in long-term transactions, so that they can gain profits from investment.
Jinwen Gaoxin official WeChat: jinwengaoxin168 [long press to copy]