At present, A shares have successfully tamed the minds of investors, allowing investors to develop a psychological change of " whenever the index falls, it is an opportunity to buy stocks ".
I believe that everyone is taking action again today, right? Of course, our turtle community has also taken action~~~~ It will make money by the close. I am not sure whether we can make money tomorrow!
Next, let’s look at the index!
weekly
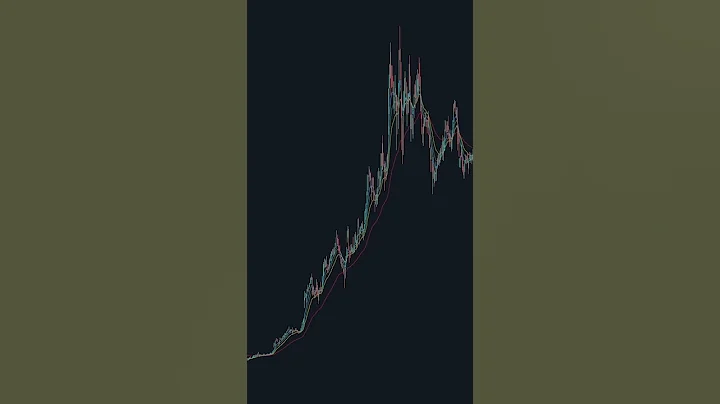
Let’s first look at the weekly pattern of Shanghai Composite Index :

This market is the weekly trend chart from June 2015 to February 2018, that is, between 5178 points and 3587 points. As a friendly reminder, after 3587 points, the Shanghai Composite Index fell to 2440 points before bottoming out.
Here, what I want to talk about is the phased daily volume K line, which is the pink arrow and yellow arrow in the picture.
at the yellow arrow : Draw a solid yellow line with the lowest point of B. This line did not stand firm at C. It fell for a while in the later period. When the bottom structure was formed, the index rose to D. After breaking the position, a Yang bag was formed. Yin structure, rising again.
In the later period, this yellow solid line became a strong support level at E.
The pink arrow is at : The lowest point of the K-line A is also used to draw the pink line. I don’t know whether it is a coincidence or the effectiveness of this method. In the later period, at F, the index is unstable. The pink line, the index Later, there was a sharp decline.
Interesting!
Next, let’s look at the recent trend. Of course, it is also the weekly market:
This market is a weekly trend chart from 2646 points to the present. The K line A is a phased volume. I use this K line A solid white line is drawn at the lowest point, a solid yellow line is drawn at the closing point, and a solid green line is drawn at the highest point.
Everyone pays attention to the lowest point of the two K lines at B, which is where the white solid line stepped back twice and then rose sharply.
The closing point of this Tianliang K-line is 3383 points , which has become one of the recent strong support levels. Another strong support level is 3358 points . And can the highest point of this Tianliu K-line, 3457, , become a target for the index to hit in the near future?
Everyone feels that the index will hit 3457 points for ?
The current weekly K-line pattern is another hanging neck line . I don’t know if this hanging neck line will become a big positive pillar by this Friday? Or is it the bardo column with a long upper shadow line of ?
daily line
Next, let’s take a look at the daily shape of the Shanghai Composite Index:
I draw a white solid line and a blue line at the highest point and closing point of the periodic sky quantity K line pointed by these two pink arrows. Solid line, these two lines are the two pressure levels today, which are 3414 points and 3430 points .
If the index cannot stand firmly at the pressure level tomorrow, it is necessary to reduce the position appropriately, and the support level tomorrow is 3394 points . If the index can stand firm, short-term positions can be increased to participate.
sector
The semiconductor index fell sharply today because "Last Friday, there was market news that TSMC encountered three major customers Apple, AMD and Nvidia cutting orders at the same time, which also made the semiconductor market situation filled with pessimism even worse. TSMC responded that it would not comment on market speculation or rumors. As soon as the news came out, TSMC's stock price plunged, causing the entire US stock market to collapse. "
As a result, the A-share semiconductor sector also collapsed today.
Is the semiconductor index hopeless?
Let’s take a look at the wave pattern of the Semiconductor Index. The white rising 5 waves constitute the big A wave, the green line is the B wave, and the pink line and yellow line form the new rising 5 wave structure. This is Big C wave.
The lowest point of today’s semiconductor index has not yet fallen below the highest point of the first rising wave. Standard, if the semiconductor index can still be saved, then there should be a counter-attack tomorrow. Tomorrow the index will stand firm at today’s highest point, and semiconductor stocks will have a chance.
's weekend article " has an adverse signal that has been formed!" "" pointed out to everyone that the hot sectors include: new energy vehicles, photovoltaic , energy storage, lithium batteries and national defense industry.
Today, 13 stocks in the energy storage sector have hit their daily limit, 11 stocks in the lithium battery sector have hit their daily limit, 10 stocks in the photovoltaic sector have hit their daily limit, and 6 stocks in the new energy vehicle sector have hit their daily limit. Of course, Tesla also has 6 stocks in the daily limit, and the number of national defense and military industry stocks has only hit 3 stocks. .
In addition, tomorrow everyone needs to pay attention to the two indexes of semiconductors and chips. I won’t talk about
stocks today. If the Turtle Community doesn’t capture the daily limit, it won’t be a big deal!