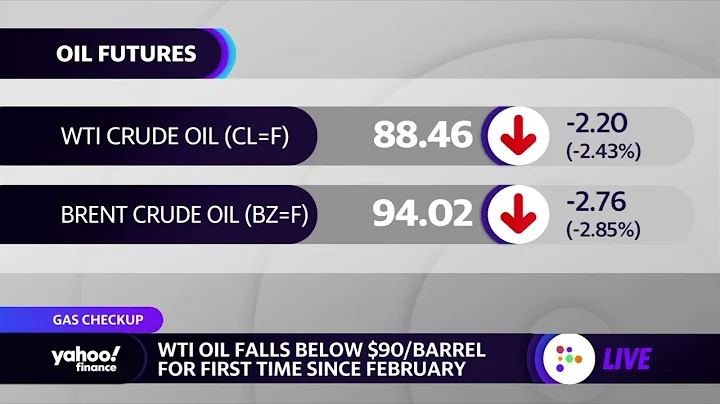
New York crude oil futures fell 19 cents, or 0.3%, to settle at $59.69 a barrel on Friday. Oil prices rose 0.5% for the week, marking the ninth consecutive week of gains. At the same time, the price of Brent North Sea crude oil futures on London's Intercontinental Exchange closed up $0.11, or 0.16%, at $66.81 a barrel on Friday, up 2.2% for the week.
The latest news on oil price adjustment: China National Petroleum Corporation will drop 0.2 yuan
China National Petroleum Corporation announced at noon yesterday that based on the floating oil price formula, starting from 0:00 tomorrow morning, the retail price of China Petroleum gasoline and diesel will be reduced by 0.2 yuan per liter, to an adjusted 92 yuan per liter of unleaded gasoline. 26.1 yuan, 95 unleaded gasoline 27.6 yuan, 98 unleaded gasoline 29.6 yuan, super diesel is reduced to 24.2 yuan per liter.
China National Petroleum Corporation said that oil prices continued to rise, and members of the Organization of the Petroleum Exporting Countries (OPEC) and U.S. shale oil companies were planning to expand production. As soon as the unexpected news came out, international oil prices responded to expectations that crude oil supply would be oversupplied. After rising, it fell again; the weekly average price of crude oil, the price adjustment indicator, dropped from US$65.2 per barrel last week to US$64.48, which translates into a retail price reduction of 0.2 yuan per liter for gasoline and diesel.

New York Mercantile Exchange (NYMEX) crude oil prices operate within a wide trading band, and trend behavior is constrained by the trading band. Current support is located near $58. Subsequent pressure levels are located at $68, $78 and $88. The $88 pressure level is the lower edge of long-term support for crude oil prices. The $88 support level impacted the market from October 2011 to October 2014.
This means that $88 will now act as a very strong and important pressure level. These support/resistance levels will also pose limitations and obstacles to the formation of any new rebound or upward trend in the future.
Data released by U.S. oil services company Baker Hughes on Friday (May 15) showed that the number of active oil rigs in the United States fell by 8 this week (the week of May 15), recording a 23rd consecutive week. fell, but the decline slowed further, bringing the number of active oil rigs to 660, a decrease of 871 year-on-year.
Global crude oil output has grown significantly faster than consumption, causing an unprecedented glut of crude oil that has filled oil tanks around the world. Data show that the Organization of the Petroleum Exporting Countries (OPEC) is still producing oil at a rate of about 30.45 million barrels per day in the first three months of this year. At the same time, the U.S. Energy Information Administration (EIA) predicts that they are also expected to further increase production, with output in the second quarter Or reach 30.55 million barrels per day.
OPEC's core members, such as Saudi Arabia and Iraq, have increased production in order to ensure their market share. This is not only to confront US shale oil, but also to meet the impact of the lifting of the Iranian oil embargo. The increased output can only take advantage of low prices to attract buyers, but much of it goes directly into storage tanks. Currently, global crude oil is about 28.25 million barrels per day, which is 2.2 million barrels less than demand.
The decline in the number of active oil rigs in the United States slowed to 8, the smallest weekly decline since December 2014. This may further indicate that the collapse of the country's oil exploration and drilling sector may be ending. However, the above data means that the number of active oil rigs in the United States has declined for 23 consecutive weeks, reaching the lowest level since September 2010.
spot crude oil market trend analysis:
weekly chart, the long upper shadow line was closed again last week, similar to the cross star Xiaoyang. The upper shadow line is three times the lower shadow line, which can largely show that the upper shadow line is The pressure begins to become very intensive, and each test will leave a long upper shadow line. In addition, the high point of each rebound begins to get lower and lower. It can also be found that the possibility of a callback is relatively high. big. From the perspective of the
k line combination, the two yang and one yin pattern in the past few weeks is undoubtedly positive. After two weeks of inertial rise, the momentum began to exhaust, resulting in the appearance of the upper shadow line. It is expected that it will also rush higher and fall first this week.Looking at the daily chart of
4 hour cycle chart, the price is running near the short-term moving average bonding zone, the trend indicator MACD is slowing down in volume, and the strength indicator is bonded at the 40-60 level. The short-term atmosphere is volatile, and the overall shape is also flattening simultaneously, with the range In terms of pattern, it is extremely important for price to confirm the neckline of the pattern around 360. If the price falls below, deep adjustments will be carried out, otherwise it will mainly maintain high levels and fluctuate;
Editor: Comprehensive Investment and Financial Management Knowledge Website - Zongtou.com (www.zt5.com) - Share A boutique website with financial knowledge and methods
To learn more about financial knowledge and financial management methods, please go to Zongtou.com (www.zt5.com) and follow the WeChat public account: touzirumen