Because the programmers apply and release memory independently in C and C++ programs, a little carelessness will lead to memory errors in the system. At the same time, memory errors are often very serious, and generally will bring serious consequences such as system crashes and memory exhaustion. This article will introduce the method of memory leak detection in the Linux environment from the perspective of static analysis and dynamic detection, and focus on the use of static analysis tool BEAM, dynamic monitoring tool Valgrind and rational purify. I believe that the introduction of this article can provide you with a reference for dealing with memory leaks related to other products or projects.
Historically, many of the most serious security bulletins from computer emergency response teams and vendors were caused by simple memory errors. Since the late 1970s, C/C++ programmers have been discussing this type of error, but its impact was still significant in 2007. Unlike many other types of common errors, memory errors are usually insidious, that is, they are difficult to reproduce, and the symptoms are usually not found in the corresponding source code. For example, whenever and wherever a memory leak occurs, it may be completely unacceptable to the application, and the memory leak is not obvious [1]. C and C++ programs with memory errors can cause various problems. If they leak memory, they will gradually slow down and eventually stop running; if they overwrite the memory, they will become very fragile and vulnerable to attacks by malicious users.
Therefore, for these reasons, you need to pay special attention to the memory problems of C and C++ programming, especially memory leaks. This article starts with how to find memory leaks, and then uses different methods and tools to locate memory leaks, and finally compares these tools, and also briefly introduces the handling of resource leaks (taking handle leaks as an example). The test platform used in this article is Linux (Redhat AS4). But many of these methods and tools are not limited to C/C++ language and Linux operating system.
Memory leak generally refers to the leak of heap memory. Heap memory refers to the free memory that is allocated by the program from the heap, of arbitrary size (the size of the memory block can be determined during the running of the program), and must be displayed after use. Applications generally use malloc, realloc, new and other functions to allocate a block of memory from the heap. After use, the program must be responsible for calling free or delete to release the memory block. Otherwise, this memory cannot be used again, and we say that this memory has leaked.
1. How to find memory leaks
Some simple memory leaks can be determined during the code inspection phase. There are also some serious leaks, which cause the program or the system to crash in a short period of time, or the system reports that there is not enough memory, which are easier to find. The most difficult thing is that the leakage is relatively slow, and it takes days, weeks, or even months of observation to see obvious abnormalities. So how to detect if there is a potential memory leak problem in a relatively short time? In fact, different systems have memory monitoring tools. We can collect stack memory information over a period of time from the monitoring tools and observe the growth trend to determine whether there is a memory leak. On the Linux platform, you can use the ps command to monitor the memory usage, such as the following command (observe the VSZ value of the specified process):
ps -aux
2. Static analysis
includes Manual detection and static tool analysis are the least expensive debugging methods.
2.1 Manual detection
When developing in C/C++, adopting a good and consistent programming specification is the first and most important measure to prevent memory problems. Detection is a supplement to the coding standard. Both have their own benefits, but the combined effect is particularly good. Professional C or C++ professionals can even browse unfamiliar source code and detect memory problems at a very low cost. With a small amount of practice and proper text search, you can quickly verify a balanced *aThe source principal of lloc() and free() or new and delete. Manually viewing such content usually causes the same problem as in Listing 1. It can be located that the heap variable Logmsg in the function LeakTest is not released.
List 1. Simple memory leak
include
include
include
int LeakTest(char * Para)
{
if(NULL==Para){
//local_log("LeakTest Func: empty parameter/n");
return -1;
}
char * Logmsg = new char[128];
if(NULL == Logmsg){
//local_log("memeory allocation failed/n");
return -2;
}
sprintf(Logmsg,"LeakTest routine exit: &x27;%s&x27;./n", Para);
//local_log(Logmsg);
return 0;
}
int main(int argc,char **argv )
{
char szInit [] = "testcase1";
LeakTest(szInit);
return 0;
}
2.2 Static code analysis tools
There are many tools for static code scanning and analysis, such as splint, PC-LINT, BEAM, etc. Because there are many platforms supported by BEAM, let's take BEAM as an example to make a brief introduction. Others have similar processes.
BEAM can detect four types of problems: uninitialized variables; obsolete null pointers; memory leaks; redundant calculations. And there are more platforms supported.
BEAM supports the following platforms:
- Linux x86 (glibc 2.2.4)
- Linux s390/s390x (glibc 2.3.3 or higher)
- Linux (PowerPC, USS) ( glibc 2.3.2 or higher)
- AIX (4.3.2+)
- Window2000 above
List 2. Code used for Beam analysis
include
include
include
int *p;
void
foo(int a)
{
7 b, c;04a#
b = 0;
if(!p) c = 1;
if(c> a)
c += p[1];
}
int LeakTest(char * Para)
{
char * Logmsg = new char[128];
if((Para==NULL)||(Logmsg == NULL))
return -1; sprintf(Logmsg,"LeakTest routine exit: &x27;%s&x27;./n", Para); return 0;
}
int main(int argc,char **argv )
{
char szInit [] = "testcase1";
LeakTest(szInit);
return 0;
}
The following code is X86 Linux as an example As shown in Listing 2, the specific environment is as follows:
OS: Red Hat Enterprise Linux AS release 4 (Nahant Update 2)
GCC: gcc version 3.4.4
BEAM: 3.4.2; https:/ /w3.eda.ibm.com/beam/
You can regard BEAM as a C/C++ compiler, and compile with the following commands (the first two commands are to set the compiler environment variables):
./beam-3.4.2/bin/beam_configure --c gcc
./beam-3.4.2/bin/beam_configure --cpp g++
./beam-3.4.2/bin/beam_compile --beam::compiler=compiler_cpp_config.tcl -cpp code2.cpp
From the compilation report below, we can see that there are three in this program Errors: "memory leak"; "variable not initialized"; "Null pointer operation"
"code2.cpp", line 10: warning: variable "b" was set but never used
int b, c ;
^
BEAM_VERSION=3.4.2
BEAM_ROOT=/home/hanzb/memdetect
BEAM_DIRECTORY_WRITE_INNOCENTS=
memory morITE#4da1a=memory ERROR#memory leak*/ >>>ERROR23_LeakTest_7b00071dc5cbb458"code2.cpp", line 24: memory leak
ONE POSSIBLE PATH LEADING TO THE ERROR:
"code2.cpp", line 22: allocating using &x60;operator new[]&x27; (this memory will not be freed)
"code2.cpp", line 22: assigning into &x60;Logmsg&x27;
"code2. cpp", line 24: deallocating &x60;Logmsg&x27; because exiting its scope (losing last pointer to the memory)
-- ERROR1 /*uninitialized*/ >>>ERROR1_foo_60c7889b2b608
"code2.cpp", line 16 : uninitialized &x60;c&x27;
ONE POSSIBLE PATH LEADING TO THE ERROR:
"code2.cpp", line 10: allocating &x60;c&x27;
"code2.cpp", line 13: the if-condition is false
"code2.cpp", line 16: getting the value of &x60;c&x27;
VALUES AT THE END OF THE PATH:
p != 0 - ERROR2 /* operating on NULL*/ >>>ERROR2_foo_af57809a2b615
"code2.cpp", line 17: invalid operation involving NULL pointer
ONE POSSIBLE PATH LEADING TO THE ERROR:
"code2.cpp", line 13: the if-condition is true (used as evidence that error is possible)
"code2.c pp", line 16: the if-condition is true
"code2.cpp", line 17: invalid operation &x60;[]&x27; involving NULL pointer &x60;p&x27;
VALUES AT THE END OF THE PATH :
c = 1 p = 0 a <=>
2.3 The embedded program
can overload the memory allocation and release functions new and delete, and then write a program to regularly count the memory allocation And release to find out possible memory leaks. Or call system functions to regularly monitor the size of the program heap. The key is to determine that the heap growth is a leak rather than a reasonable memory usage. This type of method is more complicated, so no detailed examples will be given here.
3. Dynamic running detection
Real-time detection tools mainly include valgrind, Rational purify, etc.
3.1 Valgrind

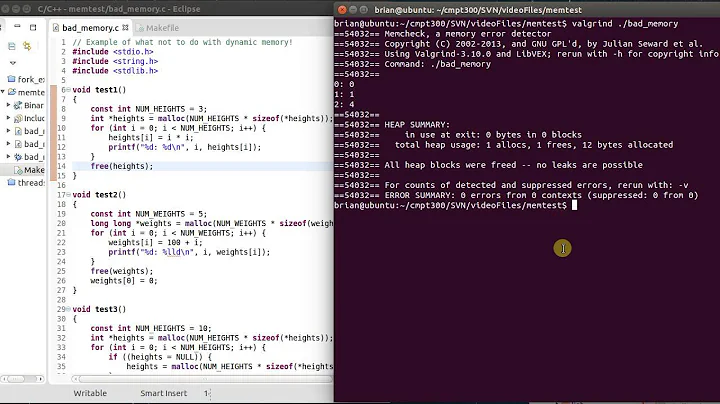
valgrind is a tool to help programmers find bugs in the program and improve program performance. When the program is run through valgrind, valgrind collects various useful information, through which you can find potential bugs and performance bottlenecks in the program.
Valgrind now provides multiple tools, the most important of which are Memcheck, Cachegrind, Massif and Callgrind. Valgrind is a tool for debugging memory problems when developing applications under Linux. It is especially good at discovering memory management problems, and it can check for memory leaks when the program is running. The memecheck tool can be used to find memory management errors in c and c++ programs. You can check out the following kinds of memory operation errors:
- Read and write memory that has been released
- Read and write memory block out of bounds (previously or later)
- Use uninitialized variables
- Passing meaningless parameters to the system call
- Memory leak
3.2 Rational purify
Rational Purify is mainly for memory errors and runtime that are difficult to find in the software development process error. In the software development process, errors are automatically found, errors are accurately located, and complete error information is provided, thereby reducing debugging time. It is also the only similar tool on the market that supports multiple platforms and can be integrated with many mainstream development tools. Purify can check every module of the application, and can even detect errors in complex multithreaded or process applications. In addition, you can not only check C/C++, but also report memory leaks in Java or .NET.
In Linux system, using Purify needs to recompile the program. The usual practice is to modify the compiler variables in the Makefile. The following is the Makefile used to compile the program in this article:
CC=purify gcc
First run purifyplus_setup.sh in the Purify installation directory to set environment variables, and then run make to recompile the program.
./purifyplus_setup.sh
The following is an example of compiling a code file, the source code file is named test3.cpp. The compiling commands with purify and g++ are as follows,'-g' means compiling with debugging information.
purify g++ -g test3.cpp –o test
Run the compiled executable file test, you can get Figure 1, you can locate the specific location of the memory leak.
./test
List 3. Purify analyzed code
include
int LeakTest(char * Para)
{
if(NULL==Para){
//local_log("LeakTest Func: empty parameter/n");
return -1;
}
Logmsg = new char [128];
for (int i = 0; i <128;>
Logmsg[i] = i%64;
if(NULL == Logmsg){
//local_log("memeory allocation failed/n");
return -2;
}
sprintf(Logmsg,"LeakTest routine exit: &x27;%s&x27;./n", Para);
//local_log(Logmsg);
return 0;
}
int main(int argc,char **argv )
{
char szInit [] = "testcase1";
int i;
LeakTest(szInit) ;
for (i=0; i <2;>
if(i%200 == 0)
LeakTest(szInit);
sleep(1);
} return 0;
}
It should be pointed out that the program must be compiled into a debug version to locate the specific line of code that has a memory leak. That is, in gcc or g++, the "-g" option must be used.
The output of purify
Conclusion
This article introduces a variety of memory leaks and location methods (including static analysis, dynamic real-time detection). A number of tools are involved, and their usage, usage, advantages and disadvantages are described in detail. It has a good reference meaning for dealing with memory leaks related to other products or projects.
--------------------Memory leak
Here, we are talking about memory leaks and errors in program design, but not All programs have this problem. First of all, some memory problems such as leaks are not easy to occur in some programming languages. These programming languages generally think that memory management is too important to be handled by programmers. It is better to let programming language designers handle these issues. Such languages include Perl, Java, and so on.
However, in some languages (the most typical ones are C and C++), the designer of the programming language also thinks that memory management is too important, but it must be handled by the developer. A memory leak refers to a programmer who dynamically allocates memory, but forgets to release it after use. In addition to memory leaks, other memory problems such as buffer overflows and dangling pointers also occur from time to time in the development of developers managing their own memory.
Why does the problem occur?
In order to allow the program to handle the unpredictable data occupancy memory size at compile time, the program must apply for memory from the operating system in real time. This is the so-called dynamic memory. At this time, there will be an error that the program has applied for the memory block and has not returned it to the operating system after it has been used. The worse situation is that the address of the acquired memory block is lost, so that the system cannot continue to identify and locate the memory block. There are other problems, such as trying to access a pointer that has been released (dangling pointer), and accessing memory that has been used (memory overflow).
Consequences cannot be ignored
For those programs that are not resident in memory, because the execution process is very short, even if there are loopholes, it may not cause particularly serious consequences. However, for some memory-resident programs (such as the Web server Apache), if such a problem occurs, the consequences will be very serious. Because there is a questionThe program in question will continue to request memory from the system and will not release the memory, which may eventually cause the system to run out of memory and cause the system to crash. In addition, programs with memory leaks will not only take up more memory, but will also cause a sharp drop in program performance. For the server, if this happens, even if the system does not crash, it will seriously affect the use.
Dangling pointer will cause some potential hidden dangers, and these hidden dangers are not easy to break out. It is very unobvious, so it is difficult to find. Of these three forms of problems, buffer overflow may be the most dangerous. In fact, it may cause a lot of security problems (a safe program contains many elements, but the most important thing is to use memory carefully). As mentioned above, sometimes the same memory block is returned to the system multiple times, which is obviously a programming error. A programmer very much wants to know the memory usage in the process of running the program, so that he can find and correct the problem.
How to deal with
Now there are some technologies for real-time monitoring of memory problems. Memory leaks can be discovered and resolved by periodically terminating and restarting the problematic program. In the relatively new Linux kernel version, there is an algorithm called OOM (Out Of Memory) killer, which can choose to execute programs such as Killed when necessary. Dangling pointers can be resolved by periodically zeroing all memory that has been returned to the system. There are many ways to solve the memory overflow problem.
In fact, it is obviously much more troublesome to solve these problems while the program is running, so we hope to find and solve these problems while developing the program. Here are some available free software.
Tool 1: Garbage Collector (GC)
In the GCC (download) toolkit, there is a "Garbage Collector (GC)", which can easily detect and correct many memory problems. Currently, the project is in charge of Hans-J. Boehm of HP. The technology used by
GC uses a technology called Boehm-Demers-Weiser that can continuously track memory location. Its algorithm is implemented by using standard memory positioning functions. The program uses these functions to compile and then execute, the algorithm will analyze the operation of the program. The algorithm is very famous and relatively easy to understand, and will not cause problems or interfere with the program.
Performance
This tool has very good performance, so it can effectively improve program efficiency. The code is very small and can be used directly in GCC.
This tool has no interface and is difficult to use, so it takes some time to master it. It is possible that some existing programs cannot be configured using this editor. In addition, in order for all calls to be captured, all memory calls (such as malloc() and free()) must be replaced by corresponding functions provided by GC. We can also use macros to accomplish this work, but still feel that it is not flexible enough.
Conclusion
If you want a cross-platform (architecture, operating system) solution, then this is it.
Tool 2: Memprof
Memprof (download) is a very attractive and very easy-to-use software, which was founded by Owen Talyor of Red Hat. This tool is the Boehm-Demers-Weiser garbage collector for the front end of GNOME. The technology used by
In terms of its core technology, Memprof is not essentially different from the GC mentioned above. However, when implementing this function, it captures all memory requests from the program and relocates them to the garbage collector in real time.
Performance
The performance of this tool is very good, and its GUI design is also good (as shown in Figure 1). This tool can be executed directly, and it works without any modification to the source code. When the program is executed, this tool will